WHO and UNICEF Report Persistent Gaps in Household Water Services
A joint monitoring update examines the reliability and reach of essential household services.
The update
A WHO and UNICEF monitoring release published in August 2025 estimated that 2.1 billion people lacked safely managed drinking water. The assessment covers progress through 2024 and highlights disparities affecting rural communities, fragile settings and lower-income populations.
More than a water source
The report separates drinking water, sanitation and hygiene indicators. Safely managed water is a defined monitoring category, not simply another phrase for having a tap nearby. A headline about one service should not be used as a substitute for the other measures.
What residents experience
As editorial context, the availability of an essential service is also a question of practical access. Distance, interruptions and clear communication can affect how a household organizes its day. Local evidence is needed before drawing conclusions about a particular neighbourhood or water provider.
A dated global picture
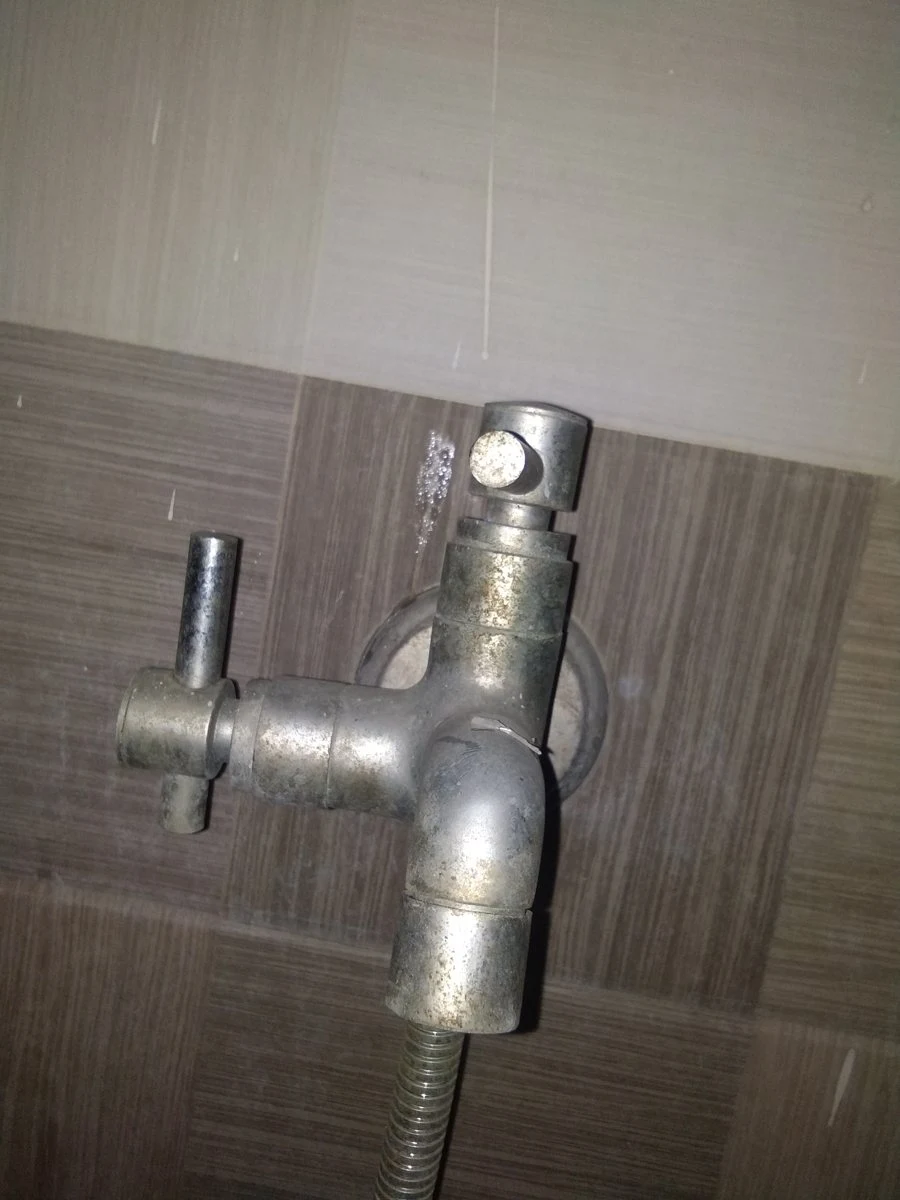
The linked release explains the underlying monitoring categories and reference period. These are global estimates reported in 2025, not a live assessment of water quality. The archive photograph illustrates a water fixture and does not document the communities counted in the report.
Background and interpretation. The following sections add editorial explanation to the dated report. Hypothetical examples are illustrations, not newly reported events or interviews.
An essential service has several dimensions
A water service can be discussed in terms of a source, a connection, its availability or a defined level of management. Those descriptions are related, but they do not automatically establish the same condition. The original release uses monitoring categories that should remain attached to the reported figures. A reader should not replace a specific category with a looser everyday phrase and assume the meaning is unchanged. This is the first step toward understanding a global service estimate: identify the condition being measured before interpreting what its presence or absence says about a household's experience.
Why three service areas remain separate
Drinking water, sanitation and hygiene belong to a connected public-service discussion, but a figure for one should not be substituted for another. An account that combines them into a single undifferentiated access number can lose information. The source distinguishes these areas because they answer different questions. A fuller explanation can show how the subjects relate while preserving the separate indicators. It should also avoid implying that improvement in one necessarily means that every other condition improved by the same amount or at the same time for the same people.
The experience behind a connection
As editorial context, the existence of a physical fixture is only one possible part of a household's service journey. A local inquiry might ask whether information is clear, whether interruptions are recorded and how residents report a problem. Those are questions to investigate rather than findings established by the global report. They help readers connect infrastructure with the way a service is used. The photograph of a tap is therefore a reference image, not proof of the monitoring status of a household, the quality of water flowing through it or the performance of a particular provider.
A hypothetical comparison of two households
Consider two fictional households that each have a nearby water fixture. Their experiences could still differ in ways that a photograph would not reveal. The relevant monitoring category would have to be assessed through the appropriate information, not inferred from the appearance of the fixture. This example illustrates why a service statistic needs a definition and method. It is not a water-quality assessment or advice about using a particular supply. The analytical point is that similar visible infrastructure does not automatically establish identical service conditions, just as different-looking fixtures do not by themselves demonstrate different outcomes.
Understanding rates and remaining gaps
An increase in coverage can coexist with a substantial number of people still outside the defined service level. The rate and the count need the relevant population and reference period. If that population changes, the relationship between the two figures can also change. A responsible summary explains what improved and what remains unresolved rather than forcing the evidence into a simple success-or-failure label. It also makes clear whether a statement concerns one monitoring category or a broader description of services. The precision of the underlying definition is what makes the comparison useful.
Why geographic averages can hide uneven experiences
An average across a country or region is not a description of every place within it. More detailed analysis may be needed to understand differences between covered groups or locations. When such information is unavailable, the absence should remain visible. A broad estimate should not be used to assign a service condition to a named community without supporting local data. This principle also matters in the opposite direction: one well-documented local case should not automatically be presented as representative of an entire country. Global monitoring and local reporting can complement one another without replacing each other's evidence.
What an infrastructure announcement establishes
A statement about constructing or repairing facilities describes an activity. Demonstrating a sustained change in service conditions requires suitable follow-up measures. Readers can ask which population was intended to benefit, which indicator was expected to change and when that result would be assessed. This is an editorial framework, not an evaluation of a named project. It distinguishes a completed physical task from the broader public-service outcome associated with it. Both can be important, but describing the link clearly prevents an announcement from claiming more than its available evidence can establish.
Reading information without making a personal safety judgment
This article summarizes monitoring and public-service questions. It does not determine whether water from an individual source is safe to use, and an archive photograph cannot answer that question. A personal or local assessment would require relevant current information from the responsible authority or appropriately qualified sources. Maintaining that boundary is part of accurate reporting. It allows an international story to explain the scale and structure of an issue without turning general statistics into a decision about a particular household's supply or creating a sense of certainty that the evidence does not support.
What to carry forward from the report
The enduring lesson is to keep the category, population and date connected. Doing so makes it easier to understand progress, identify the scope of remaining gaps and compare later updates fairly. The expanded context adds questions about service journeys, averages and the difference between construction and outcomes. Those are interpretive tools rather than new findings attributed to the release. The linked joint report remains the source for the dated global estimates and its formal monitoring definitions. Readers can use those definitions to guide further inquiry without assuming that one headline or photograph captures every dimension of access.
Communication is observable without being a quality test
A local service story can examine whether notices identify a place, time and responsible contact clearly. That is an observable communication question, but it is not the same as testing a supply or assigning a monitoring category. Keeping the distinction visible prevents a well-designed message from being treated as proof of every service outcome. It also allows an information problem to be reported accurately without making an unsupported claim about the physical condition of the service itself.
Publication dates and statistical reference periods may differ. Figures are attributed to the linked source. Archive images provide context and do not document the reported event.
Source & verification
Primary source: WHO and UNICEF — 2025-08-26. Read the original for definitions, methodology and subsequent revisions. The source organization does not sponsor or endorse this publication.
 ITU Reports Wider Internet Access, With Two Billion Still Offline
 ILO Outlook Separates Stable Unemployment From the Quality of Work